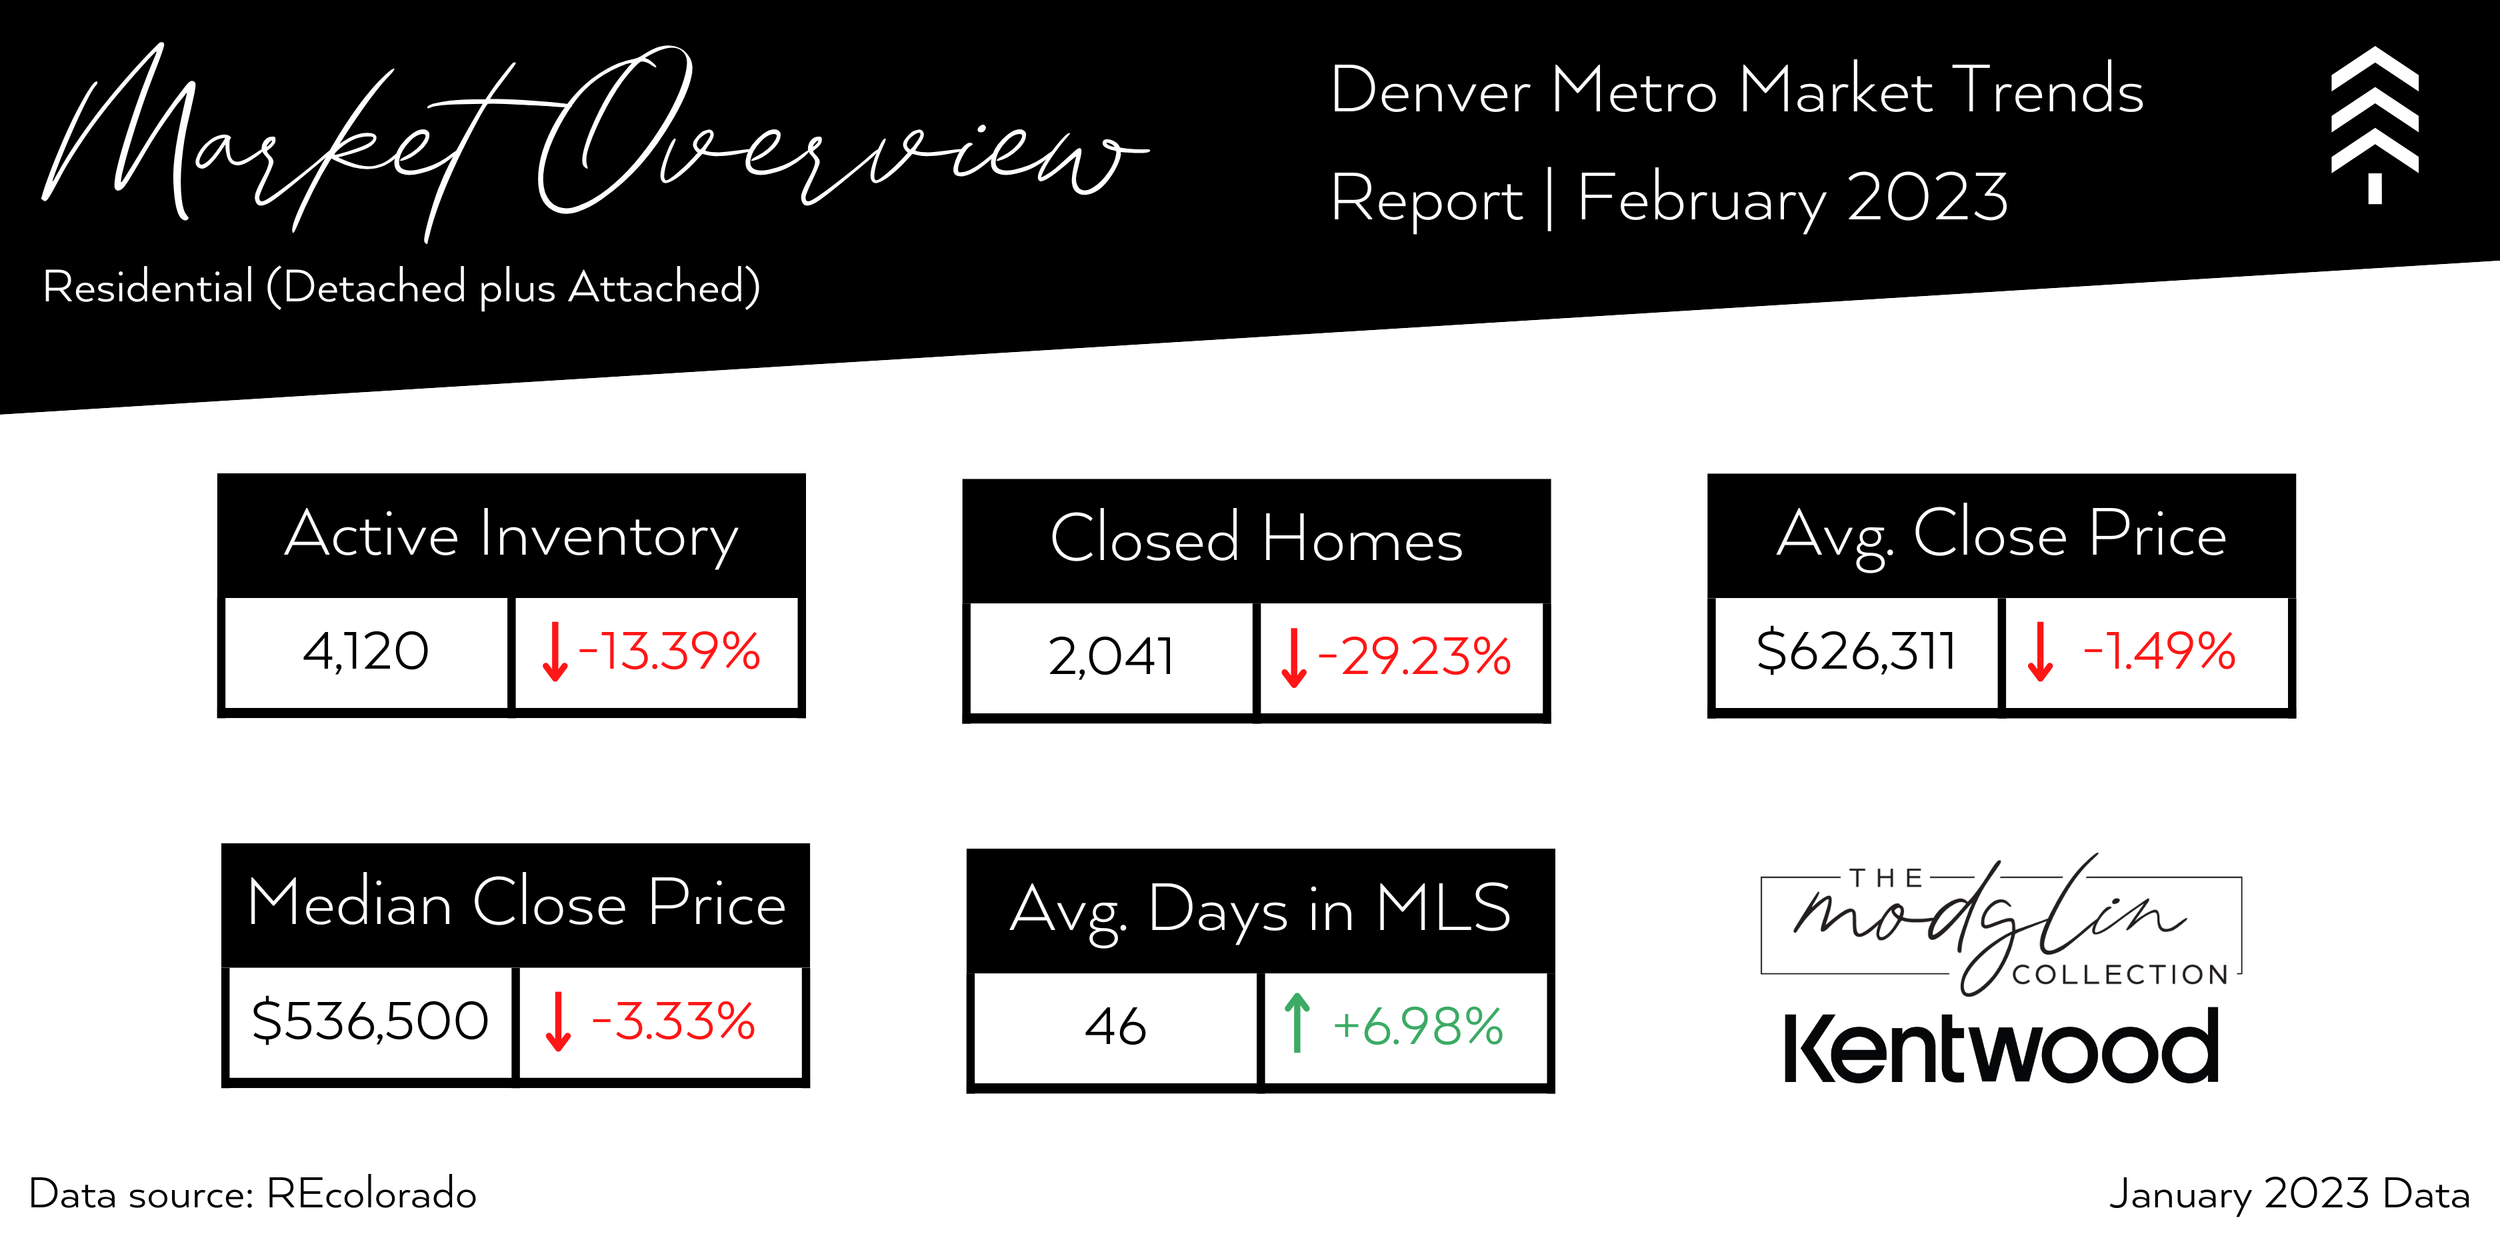
Digging Deeper: All-Time Records | January 2023
ACTIVE LISTINGS
(Residential) High – July 2006 of 31,98 | Low – January 2022 of 1,184
(Detached) High – July 2006 of 23,442 | Low – February 2022 of 853
(Attached) High – June 2006 of 8,670 | Low – February 2022 of 373
CLOSE PRICE — MEDIAN
(Residential) High – April 2022 of $616,500
(Detached) High – April 2022 of $680,000
(Attached) High – April 2022 of $440,000
CLOSE PRICE — AVERAGE
(Residential) High – April 2022 of $721,767
(Detached) High – April 2022 of $821,258
(Attached) High – June 2022 of $500,170
DAYS IN MLS — MEDIAN
(Residential) High – January 2011 of 78 days | Low – Mar. thru Jul. 2021 & Feb. thru May 2022 of 4 days
(Detached) High – January & February 2011 of 77 days | Low – Feb. thru Jul. 2021 & Feb. thru May 2022 of 4 days
(Attached) High – January 2011 of 81 days | Low – April 2015 & Apr. thru Jul. 2021 & Feb. thru May 2022 of 4 days
DAYS IN MLS — AVERAGE
(Residential) High – February 2011 of 108 days | Low – April 2022 of 8 days
(Detached) High – January 2011 of 107 days | Low – May & June 2021 of 8 days
(Attached) High – April 2011 of 115 days | Low – April 2022 of 8 days
NEW LISTINGS
(Residential) High – April 2010 of 12,783 | Low – December 2022 of 1,730
(Detached) High – April 2010 of 10,140 | Low – December 2022 of 1,178
(Attached) High – March 2010 of 2,674 | Low – December 2007 of 506
CLOSED
(Residential) High – July 2020 of 7,398 | Low – February 1988 of 1,085
(Detached) High – July 2020 of 5,309 | Low – January 2023 of 1,428
(Attached) High – July 2020 of 2,089 | Low – January 2011 of 402
MONTHS OF INVENTORY (MOI)
(Residential) High – February 1988 of 17.69 | December 2021 of 0.33
(Detached) High – January 2011 of 9.21 | Low – December 2021 of 0.31
(Attached) High – January 2011 of 10.39 | Low – December 2021 of 0.38
PENDING
(Residential) High – June 2020 of 7,294 | Low – January 1991 of 1,364
(Detached) High – June 2013 of 5,577 | Low – January 2009 of 1,542
(Attached) High – June 2020 of 2,093 | Low – January 2009 of 364
DMAR Market Trends Committee